
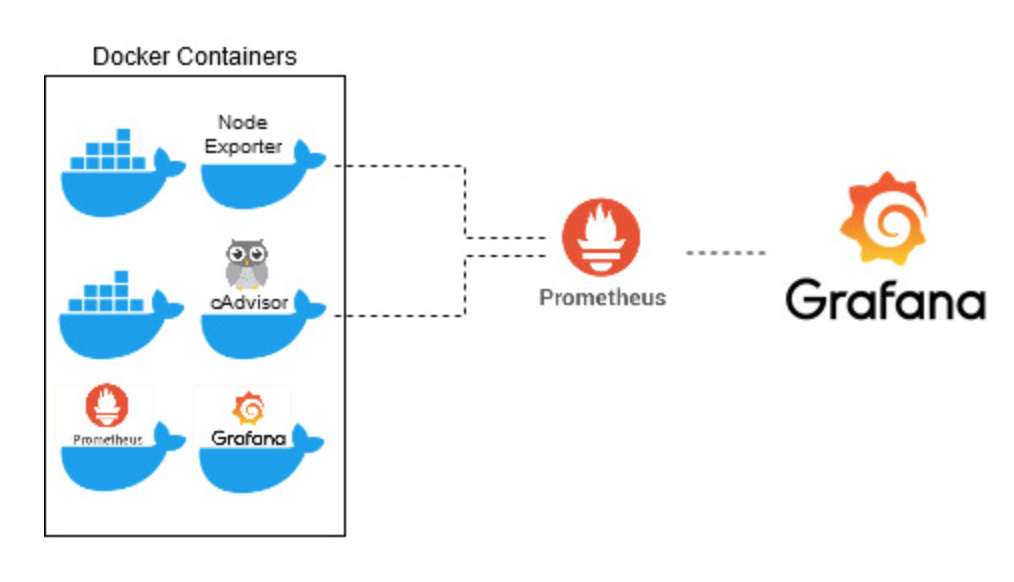
We are going to show, how to implement monitoring for Docker containers and the hosted machine using Docker images (Grafana and Prometheus). We will use the following open-source applications for the monitoring task:
1. Prometheus: is a time series database used for monitoring.
Prometheus’s main features are:
- A multi-dimensional data model with time series data identified by metric name and key/value pairs
- PromQL, a flexible query language to leverage this dimensionality
- No reliance on distributed storage; single server nodes are autonomous
- Time series collection happens via a pull model over HTTP
- Pushing time series is supported via an intermediary gateway
- Targets are discovered via service discovery or static configuration
- Multiple modes of graphing and dashboarding support
Prometheus Components:
A typical monitoring platform with Prometheus is composed of multiple tools:
- Prometheus server: the main Prometheus server which scrapes and stores time series data
- Client libraries: client libraries for instrumenting application code
- Push gateway: a push gateway for supporting short-lived jobs
- Exporters: special-purpose exporters for services like HAProxy, StatsD, Graphite, etc.
- Alertmanager: an alertmanager to handle alerts

- 2. Grafana : GUI or Frontend for Prometheus.
- Grafana is a multi-platform open-source analytics and interactive visualization web application. It provides charts, graphs, and alerts for the web when connected to supported data sources. It can be easily installed using Docker or Docker Compose

Grafana connects with every possible data source such as Prometheus, MySQL, Graphite, ElasticSearch, PostgreSQL etc. The open-source nature of the solution helps us alternatively write custom plugins to connect with any data source of our choice. in our case, we will use Prometheus as a data-source - 3. cAdvisor : is an open-source tool developed by Google to monitor containers. It can collect, aggregate, process, and export container-based metrics such as CPU and memory usage, filesystem, and network statistics
- 4. Node exporter : is an open-source time-series monitoring and alerting system for cloud-native environments, including Kubernetes, hosted by the (CNCF), and we are going to use it to monitor the hosted machine.
Grafana Dashboard used :
Node Exporter ( ID: 1860 )
Docker Host & Container Overview ( ID:395 )
Docker monitoring with node selection (ID: 8321)

0 comments